Resilience is defined as the capacity to recover quickly from difficulties.
In our never ending race to compete and remain competitive we often adopt strategies that make our organisation more lean. We continually optimise our logistics for cost efficiency. We rely on just-in-time supply chains that make materials available just before they are needed in the manufacturing process. We operate in a finely tuned synchronised dance with our supply chain.
Reality for organisations today
The reality for many organisations today is that risks are endemic. When efficiency is the only consideration there is high likelihood that risk is increased. And if your risks increase then your resilience may decrease.
Risk and resilience are highly related. If you systematically identify the risks to your organisation and understand the consequences should those risks come to pass, you can take steps that mitigate or even eliminate some or all of those risks.
This will help increase your resilience.
Here's an example
Let’s say an organisation is reliant on a single supplier for an ingredient and the lead time for order fulfilment is one month.
If something were to happen to that supplier (fire, strike, bankruptcy, etc) then there is a serious consequence for the organisation. This supplier represents a single-point-of- failure. If the supplier fails, the organisation fails.
If however, this was picked up in a risk assessment, and in mitigation a second supplier was engaged that can supply with a three-day lead time but at a higher cost, then the risk represented by an adverse event with the main low-cost supplier is significantly reduced, giving the organisation the breathing space to find another supplier or to adjust to the higher pricing.
In this simple example, the resilience of the organisation is improved. In practice, it can be more complicated than this.
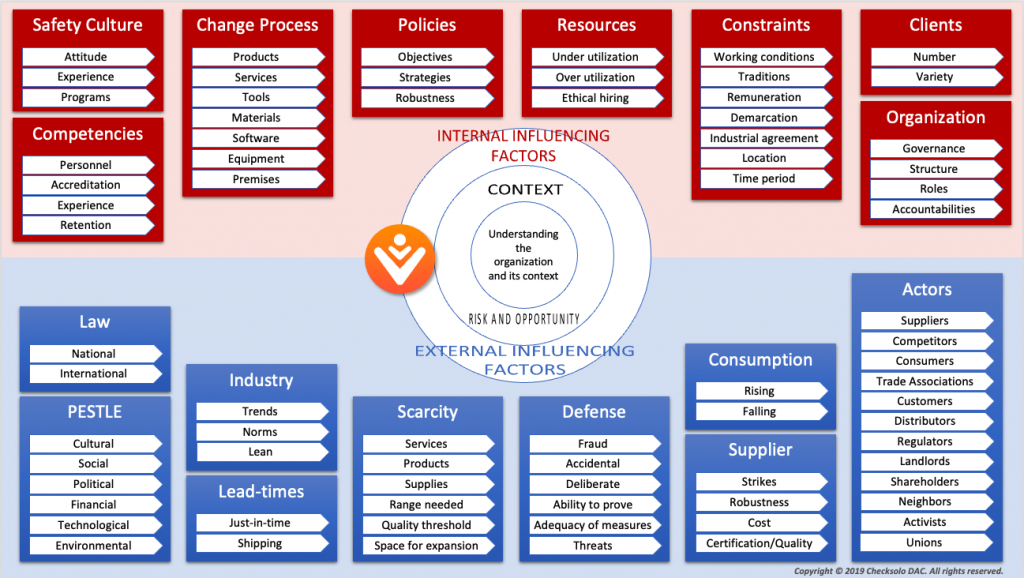
Areas of risk that may apply within an organisation
The chart above shows a range of categories and areas of risk that may apply to your organisation. You may think of others that would specifically apply to your organisation.
The objective of the chart is to help you visualise potential areas of risk across your organisation.
Good practice approach to risk management is to create a risk register for the organisation.
A risk register is an evolving resource. It starts out as a simple list that ultimately is transformed as each risk is taken through a simple process.
How to discover these risks?
The objective of the process is to discover the greatest risks to the company and take steps to mitigate the risks.
Once a risk has been identified the second stage in the process is to evaluate the likelihood that the risk will happen.
Typically the evaluation is a score from 1 to 5 where 1 indicates that there is extremely low chance that the risk will happen and 5 indicates there is an extremely high chance that the risk will happen.
What is the likelihood of the risks happening?
Evaluate the likelihood of the risk taking place. In this example we attach a rating to represent the likelihood, where a rating of 1 means that there is no likelihood, and a rating of 5 means that there is a high likelihood.
Evaluate the likelihood of the risk taking place
What is the consequences of the risk?
Next evaluate the consequences of that risk happening. It is important to consider consequences under a range of headings. Here is a suggested list of headings:
Financial
Reputation / brand
Environment
Health & safety
Risk to life
Production
Commercial
Compliance / regulatory
By giving consideration to the consequences of risk across a range of headings we get a significantly more informed view of how your organisation may be impacted by a risk.
We use a similar scoring system (1 – 5) to rate the consequences of a risk under a given heading, where 1 represents No-to-low consequence and 5 represents extreme consequence.
Once all risks have been evaluated in terms of likelihood of happening and the consequences of happening the risks can be plotted in a table that gives an effective heat-map of risk. There will be one table for each of the types of consequences evaluated.
By multiplying the likelihood score by the consequence score we derive a risk score. The higher the risk score, the greater the risk to the organisation.
A good electronic QMS will plot these tables for you, slotting each risk into the appropriate cell in the table.
How to establish a risk score?
Mitigating risk likelihood
Once the risks are plotted in the table it is possible to consider mitigations for the risks.
Start with the red risks, then the orange, then the yellow, and finally the green. Always start by looking at the likelihood of the risk happening.
The objective is to identify a mitigation that will move the risk to the left like in the chart below.
Sometimes it is possible to eliminate a process or way of doing something. Clearly this is an ideal mitigation.
Alternatively look for changes or improvement to a process that will reduce the likelihood or consider an appropriate regime of monitoring and training to help minimise the likelihood.
Mitigating risk consequence
Once the mitigations for the likelihood of a risk have been defined we re-evaluate the likelihood and plot the table of risks again.
If the mitigations are effective there should be a noticeable migration of risk from the red zone towards the green zone.
Start again with the red risks, then the orange, then the yellow, and finally the green. This time around focus on mitigation of consequences associated with the risk.
The objective is to eliminate the consequence, if possible, or at least find a mitigation or collection of mitigations that will reduce the consequence score.
Dealing with consequences are more challenging
You will notice that this is significantly more challenging than trying to find mitigations for the likelihood of the risk. However, it is frequently possible.
Earlier we looked at an example of having a single point of failure in your supply chain for a critical ingredient. In that example, the mitigation strategy focussed on the consequences of failure of the supplier.
Let’s look at another simple mitigation strategy that addresses consequences of a risk rather than the likelihood of the risk.
Consider an airline that has identified the variability in fuel prices as a risk to their business. Their business model can cope well with small fluctuations in price. But they need protection against large and extreme fluctuations in price.
Clearly there is nothing that they can do to stop fuel prices fluctuating under market pressures. However, they can utilise hedging to guarantee that some proportion of their future fuel purchases will be at a guaranteed price.
They do this by agreeing to buy an agreed quantity of fuel at a premium on the current market price at an agreed time in the future.
If the fuel market prices remain stable then the airline ends up paying more than the market rate for their fuel. However, the price paid fits within the range of fluctuations that their business model can support.
If the fuel market prices surge then the airline ends up paying considerably less than the prevailing market rate for their fuel.
Managing risk consequences
Hedging is an effective mitigation strategy for dealing with consequences of large market swings in price. In a sense, it’s a form of insurance policy.
Insurance is one of the primary tools for mitigation of consequence.
Once the mitigations for the consequences of a risk have been defined, re-evaluate the consequences again and plot the table of risks again.
Once again, we should see a migration of risk from red towards green.
Clearly it’s not enough to define mitigations. They must be acted upon. The action must be monitored and checked. The frequency of monitoring and checking should be proportional to the risk.
Periodic review
Finally, review risks periodically.
Red risks should be reviewed very frequently. Green risks less frequently.
These simple techniques and strategies for managing risk can help improve the resilience of your organisation.
Every movement of risk from red towards green builds capacity to recover from difficulties.
If you would like to learn more about us and the VERTHOS Digital Workflow Platform, please contact us using the form below. We would love to hear from you: